Now that 2017 is behind us I wanted to take a look at how things went for Helm and the community charts in 2017. When starting a new year I like to look back at the past year to see how things have gone. And, since these projects fall under Kubernetes SIG Apps they are of interest to me.
Helm Stats
One way to look at Helm is to look at publicly available statistics and information. With that we can attempt to analyze the data to see what it means.
Contributors
As of today, Helm has 249 contributors. That’s more than other CNCF projects like prometheus, fluentd, linkerd, or jaeger. This is 11 more contributors than when I gave the SIG Apps update at KubeCon in December, just a month ago. If we look at Helm in early 2017 on March 3rd (which you can view in the wayback machine) you’ll see that there were 113 contributors. In approximately 10 months time the Helm project added 136 contributors to more than double the total number of contributors.
Where those contributors have come from is also worth looking at. Doing a little legwork to track down contributor profiles, there have been contributions from people who work at Microsoft, Google, Samsung SDS, Bitnami, CoreOS, Adobe, Hootsuite, Intel, Suse, NBC Universal, SAP, HPE, Mirantis, Alibaba, Nokia, IBM, and others.
Contributions
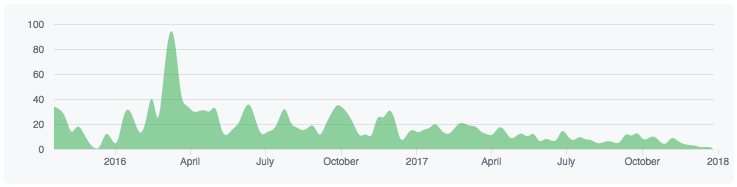
If you look at the amount of contributions to Helm you’ll notice they’ve gone down compared to 2016. In 2016 there were 2254 commits to master. That number went down to 1246 commits in 2017 which is just 55% the number of commits.
Musing: A Different Type Of Contribution
This begs the question, why did Helm have so many more contributors while having so many fewer commits? There are two reasons that come to mind:
- Helm 2.x hit a stable point. Helm 2.0.0 was released in November of 2016. Leading up to that there was an incredible amount of work done to merge the Helm and deployment manager projects into one new project of Helm version 2. Once Helm 2 was out the door the APIs have remained relatively stable with bug fixes and feature additions being the focus. This is a different kind of contribution born out of, I think, stability.
- With Helm 2 being stable its developers went to work on other projects that build on Helm. For example, in 2017 we saw the release of Draft, Brigade, and the rise of Monocular (that technically started before 2017). There were also others building on top of Helm with projects like Armada.
It will be interesting to see how contributions change in 2018 with plans to work on Helm 3 where APIs can change. While making breaking changes is useful, especially with all the change that’s happened in Kubernetes, it’s important to acknowledge how important stability is for anyone who wants to run production workloads.
Installations
It’s difficult to get good numbers for downloads at the moment. Some of that has to do with access to data and some of it has to do with how we are able to distinguish between things like user downloads and our own CI tooling downloads.
We can get some representative information from external sources.
Homebrew, the macOS package manger, provides statistics for package downloads going back a certain period. It’s important to note that Helm runs on Windows and Linux along with there being multiple download methods for Mac.
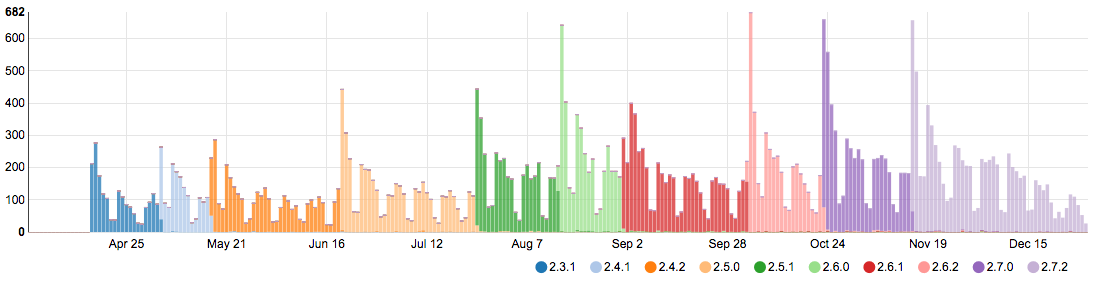
With that in mind, between April 16, 2017 and December 31, 2017 there were over 48,800 installations for Helm. And, that number grew over time with newer versions which shows usage growth even as people upgrade versions.
Note, this is just representative. We do hope to have better statistics in the future.
Community Charts Stats
The community charts are a place to share common charts (Helms version of packages) that try to use best practices. People and companies are encouraged to have their own charts and chart repositories. But, a shared set is available for the community as well. This has been a good place for projects like Datadog to share their installation into a Kubernetes cluster.
Number Of Charts
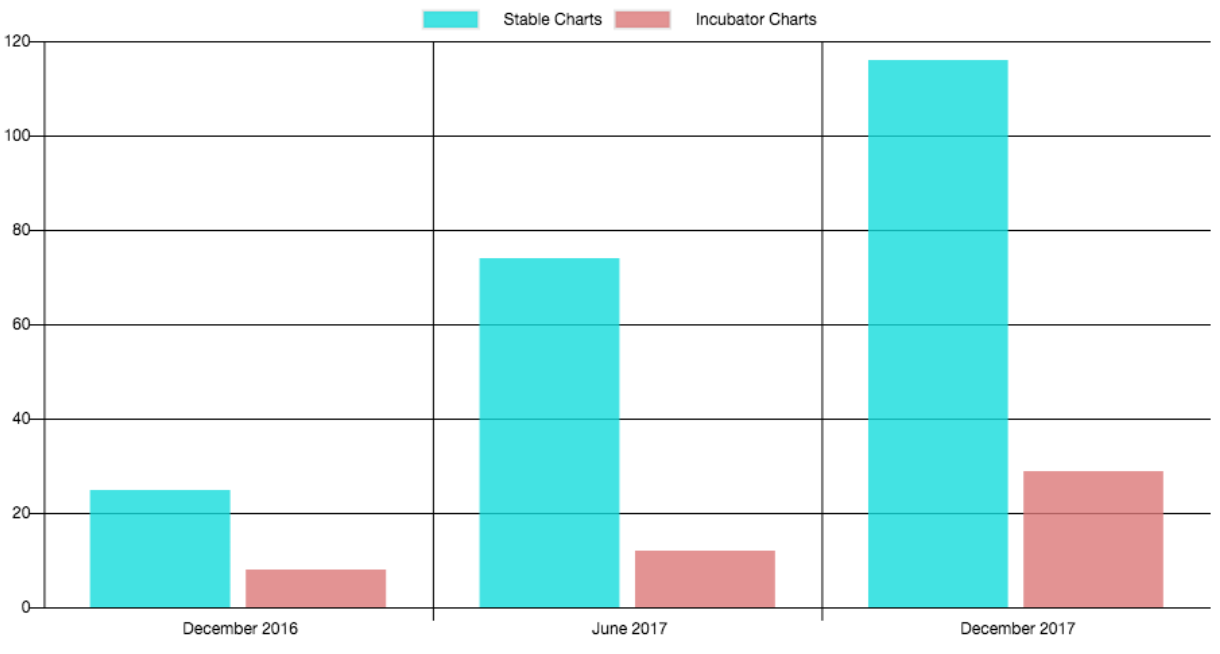
The total number of community charts grew quite a bit over the year:
- December 2016: 25 stable charts, 8 incubator charts
- June 2017: 74 stable charts, 12 incubator charts
- December 2017: 116 stable charts, 29 incubator charts
There are over 4.5 times as many charts in December 2017 as there were in December 2016. That’s good growth that highlights people are using the community charts to share and collaborate.
Contributors
As of today, the community charts have had 487 contributors. In May of 2016 there had been 160 contributors. In September 2016 there had been 293 contributors. And, on December 12th, 2017, just a few days after KubeCon ended, there had been 427 contributors. Between May and December the number of contributors grew by 2.66 times. In the past month there have been 60 new contributors to charts. I’m even surprised reading that last number.
Contributions
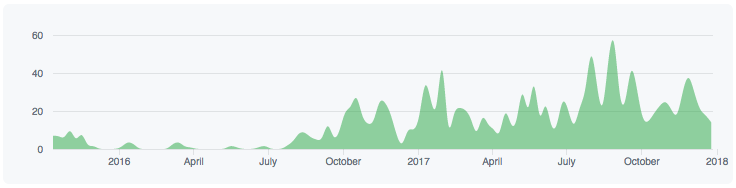
If you look at the contributions to the community charts you’ll see massive growth in 2017 since Helm 2 was released at the end of 2016. The contributions to the community charts started just before Helm 2 was release in the ramp up to it. In 2016 there were 391 commits to the charts. In 2017 that number grew to 1717 commits.
Musing: Contribution Problems and Solutions
A subtle thing you’ll find in the data is that chart contributions started to plateau as 2017 went on. While individual charts had maintainers who owned and drove their development, changes could only be merged by a much smaller group of people who maintained the charts repository. That small group of people wasn’t scaling.
To improve the situation the charts maintainers implemented two things:
- Testing was improved (and continues to improve). For example, CircleCI was introduced to provide much faster feedback. The Kubernetes CI system will run right away for those in the community but requires a community member to trigger it for those who are not part of the community. That’s because some jobs run for a long time on our infrastructure and we want to have some accountability. Many of the contributors to charts are new contributors who don’t get the instant feedback from the Kubernetes CI system. CircleCI was introduced to help with that.
- OWNERS files were introduced for charts. Now, chart maintainers can be asked to review pull requests for their charts by the automation and merge changes into their charts.
The idea here was to put best practices into CI along with better testing. Then enable more chart owners to merge changes themselves. Automate and spread the load.
Chart Downloads: The Missing Data Point
With many package managers you are able to get download statistics. It turns out that’s hard for charts. Not because we aren’t capturing the data but due to the quality of the data we capture.
For example, kubeapps.com regularly downloads charts to extract data from within the packages. Until recently, we have not had a way to track downloads for this from downloads for custom installs of Monocular from downloads for Helm itself.
To combat this problem, and improve the quality of the data, we are working to introduce user agent strings into the clients. Once we have better data we hope to share more of it.
I do want to give a hat tip to Vic Iglesias for his work in this space.
In Conclusion
Or rather, my conclusions:
- Helm in 2017 showed signs of being a mature project
- Stability and long term innovation both have a place. With Helm 3 we can look at breaking changes while Helm 2 is focused on stability for people who need production workloads
- It’s entirely possible to build on top of Helm. There are numerous projects that showcase how to do that. Helm is a building block which I didn’t expect to see at the start of 2017
- Community charts are growing and finding their place
- 2017 was a good year for Helm and the community charts